Renewable Power Generation Costs in 2018

Renewable energy has become an increasingly competitive way to meet new power generation needs. This comprehensive cost study from the International Renewable Energy Agency (IRENA) highlights the latest trends for each of the main renewable power technologies.
Released ahead of high-profile United Nations energy and climate discussions, Renewable Power Generation Costs in 2018draws on cost and auction price data from projects around the world.
Costs from all commercially available renewable power generation technologies declined in 2018. The global weighted-average cost of electricity declined 26% year-on-year for concentrated solar power (CSP), followed by bioenergy (-14%), solar photovoltaic (PV) and onshore wind (both -13%), hydropower (-12%), geothermal and offshore wind (both -1%),the report finds.
Continuing cost declines, meanwhile, underline renewable power as a low-cost climate and decarbonisation solution. Within IRENA’s global database, over three-quarters of the onshore wind and four-fifths of the utility-scale solar PV project capacity due to be commissioned in 2020 should provide lower-priced electricity than the cheapest new coal-fired, oil or natural gas option, the report notes.
Among other findings:
- Onshore wind and solar PV power are now, frequently, less expensive than any fossil-fuel option, without financial assistance.
- New solar and wind installations will increasingly undercut even the operating-only costs of existing coal-fired plants.
- Low and falling technology costs make renewables the competitive backbone of energy decarbonisation – a crucial climate goal.
- Cost forecasts for solar PV and onshore wind continue to be revised as new data emerges, with renewables consistently beating earlier expectations.
Along with reviewing cost trends, the report analyses cost components in detail. The report draws on IRENA’s cost database of around 17 000 renewable power generation projects and 9 000 auction and power purchase agreements for renewable power.
Sample figure
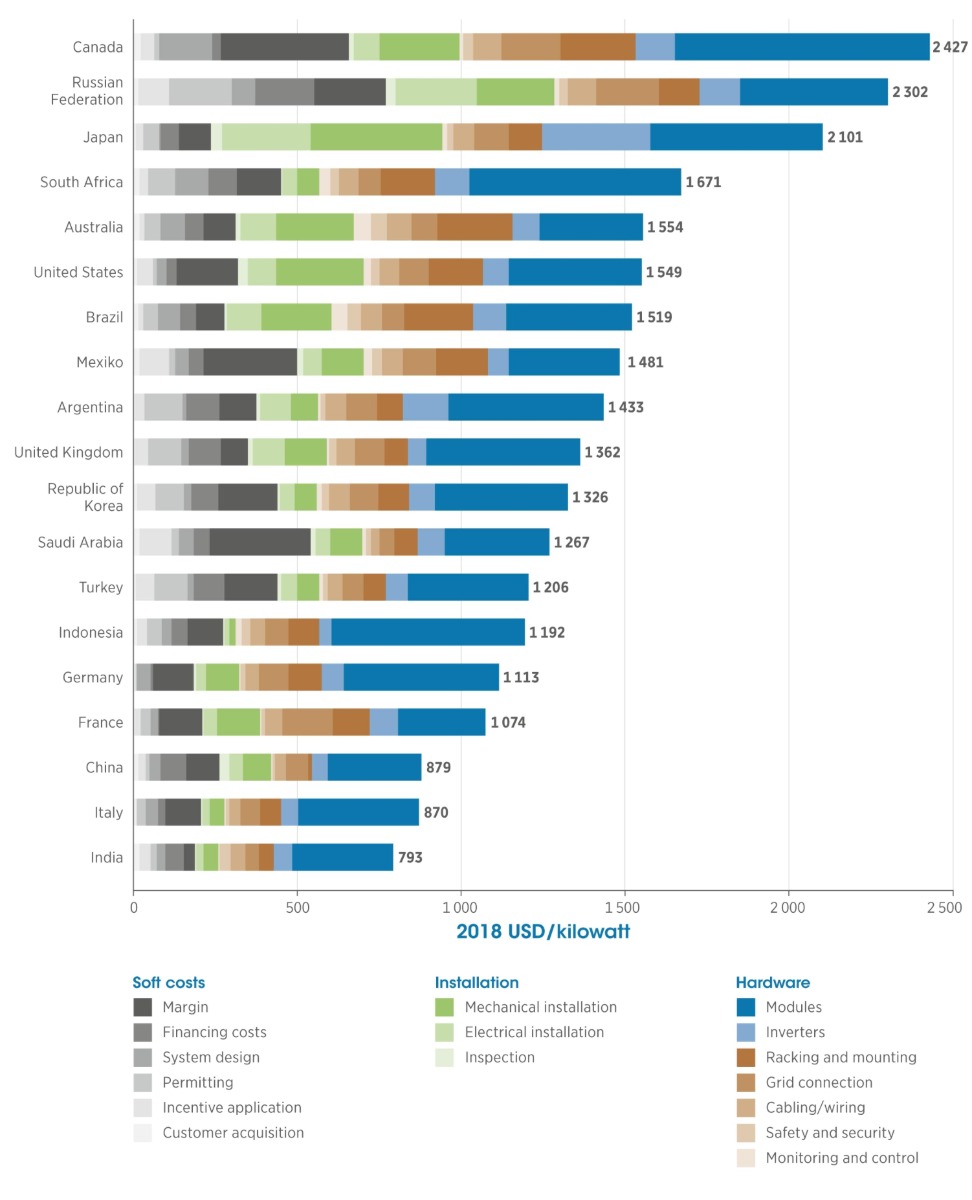
Utility-scale solar PV:
Total installed costs in 2018 by component and country
