Highlights
- A cumulative cash flow analysis is presented for a natural gas power plant.
- Wind and solar expansion can strongly improve the profitability of natural gas power plants because their value decline leads directly to a value increase for load-following plants.
- CO2 price increases pose an important risk for natural gas power plants, but this risk could be cancelled out by the value gain from increased wind and solar market share.
- The other important risk is natural gas price volatility, but this is a risk that the industry has decades of experience with.
Introduction
Past articles in this series offered some qualitative discussions on the risks involved in several mainstream energy options. Following the previous articles on onshore wind, utility-scale solar PV and nuclear, this article will present a quantitative analysis of these risks for natural gas. The final article, on coal, will follow soon. The analysis will be presented for a typical developed world scenario. Developing world technology cost levels are very different and will be covered in a future article.
All the most influential assumptions will be clearly explained and their impact on the results will be quantified in a sensitivity analysis. This will give the reader the opportunity to clearly see the quantified impact of the risk under the assumptions they think are the most appropriate.
Methodology
Results will be presented in the form of a discounted cash flow analysis for only 1 kW gas power over a two year construction period followed by a 40 year operating period. The investment is made linearly over the two year construction period, followed by the annual receipt of revenues from electricity sales and payment of fuel and operating and maintenance (O&M) costs.
Capital costs are taken as $1250/kW. This was found to be a good global average when adjusting for purchasing power parity. O&M costs are taken as 2.5% of the capital cost per year and these costs are assumed to increase linearly by 1% per year. Fuel costs were taken as $6/GJ (costs per GJ are almost equivalent to costs per MMBtu) and plant efficiency was taken to be 60%. These assumptions were derived from cost data presented in a 2015 IEA report on electricity costs.
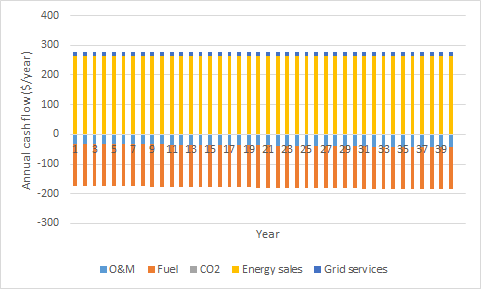
After the initial $1250 capital investment, the annual cash flows from electricity sales at an average wholesale price of $60/MWh and a capacity factor of 45% are shown below. In addition, it was assumed that this load-following gas plant earns 105% of the average wholesale price when no wind and solar are on the grid because it will tend to produce more electricity during times when the price is high.
Load-following plants also earn some revenues from capacity and ancillary services. According to the latest IEA world energy outlook, this represents about 5% of plant revenues in the EU and 20% in the US. We will take the low value in this analysis and assume 5% of added revenues from these grid stability services on top of energy sales.
Costs from load-following operation (startup costs and reduced efficiency) are small. For a 45% capacity factor, the impact of frequent plant restarts or frequent part-load operation amounts to only about $1/MWh in levelized cost in coal plants (costs for more flexible gas plants should be slightly lower). This small added cost should be cancelled out by the conservative assumption that all O&M costs are fixed ($/kW/year) whereas, in reality, some O&M costs will decrease with lower plant utilization rates.
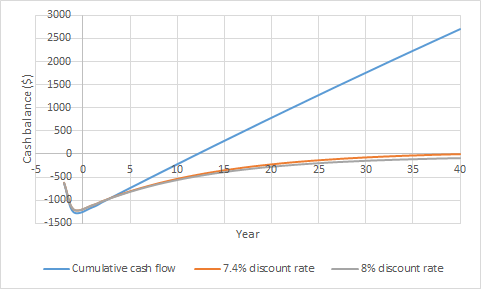
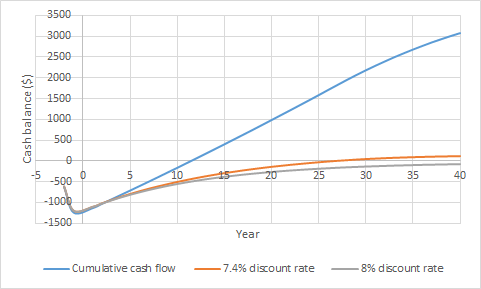
Using this information, a cumulative cash flow curve can be constructed (below). As shown, the initial $1250 investment is recovered in year 12 when no discounting is applied (discount rate of 0%). When a discount rate of 7.4% is applied, the net return on investment is zero. In other words, this analysis would return a levelized cost of electricity of $60/MWh if the discount rate is set to 7.4%. This is close to the 8% discount rate often assumed to be a good return in developed economies.
Next, the effects of a CO2 price and expanding variable renewable energy (VRE) market share over the plant lifetime are explored. The CO2 price is assumed to increase linearly at a specified rate over the lifetime of the plant. CO2 intensity of the plant is set to 0.5 ton/MWh, which includes upstream emissions (e.g. fugitive methane emissions).
Regarding VRE expansion, it is assumed that the capacity factor of the load-following plant (assumed to be 45%) is not affected by the VRE market share. VRE expansion will instead displace baseload generators (or force baseload generators to turn into load-following generators by reducing their capacity factors).
However, VRE expansion will strongly increase the average value of load-following plants. While VRE sells most of its electricity during times of low electricity prices (leading to lower average value), exactly the opposite happens to load-following plants. These plants produce most of their electricity during times of high residual demand and high prices (leading to higher average value). Greater electricity price variability from higher VRE market shares is therefore great for load-following plants.
In practice, value is increasingly transferred from VRE generators to load-following generators as the VRE market share increases. To capture this dynamic, it is assumed that average value increases by 1% for every 1% increase in VRE market share. This is a little more than half the rate at which combined wind and solar market value declines with increasing market share (below). It is assumed that VRE market share starts at 7% (current global average) and expands to a maximum market share of 60%.

Combined wind and solar expansion leads to smaller value declines than wind expansion only (source).
The annual cash flow for a CO2 price increase of $2/ton per year and a VRE expansion rate of 2% per year is shown below. The revenues of the plant increase gradually due to the increase in average value caused by the high price volatility stemming from increasing VRE market share. On the other hand, CO2 costs become as large as fuel costs at the end of the plant lifetime as CO2 prices climb to $80/ton.
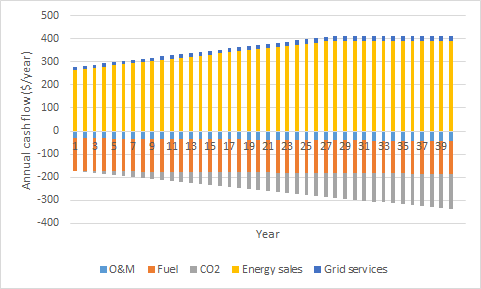
The cumulative cash flow analysis shows only minor differences due to these two competing effects, although the overall economic performance improves slightly.
Effect of the discount rate
The effect of discount rate on the average electricity price required is shown below where several different risks related to gas power plant investment are explored. Note that the average electricity price required is used here instead of the levelized cost of electricity to account for the value increase of gas power with increasing VRE market share. This measure can be interpreted as the average market price over an entire year that will yield a zero return on investment with a specified discount rate. The actual electricity price received by the gas power plants will be higher.
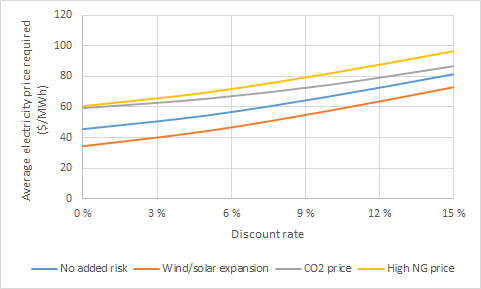
Firstly, it is clear that the effect of discount rate is much smaller than for the wind, solar and nuclear power plants discussed earlier. Natural gas power plants are relatively simple and cheap to construct, with fuel costs usually being the primary expense.
Increasing VRE market share has a substantial positive effect on the economics of a load-following natural gas plant. In essence, the load-following plant gains the value lost by the wind and solar plants, simply because it is dispatchable.
As may be expected for any fossil fuel plant, CO2 price hikes pose a major risk. Interestingly, however, this risk becomes significantly smaller with increasing discount rate because high CO2 prices are only expected later in the plant lifetime. When the discount rate is high, these high costs in the distant future are strongly discounted, minimizing the negative effect.
Since fuel cost is the major cost component of a typical natural gas power plant, a sustained increase in natural gas pricing also poses a major risk.
Quantifying the risk
Next, the three risks discussed in the previous section will be quantified in a sensitivity analysis. This quantification is done by determining the discount rate giving zero return on investment when the average electricity price is set to $60/MWh. The annualized return on investment is then quantified as the discount rate minus 2% to account for margin erosion from technological improvements of new plants that come online during the plant lifetime as well as financial/legislative costs (paying the bankers and lawyers involved in setting up financing for the plant).
As shown below, the investment return is a reasonable 5.4% under the base case assumptions (blue bar). The orange bars show that VRE expansion has a clear positive effect due to the value increase caused by high rates of VRE expansion.

As shown by the grey bars, an increase in CO2 price causes large reductions in investment returns. The plant becomes unprofitable after 26 and 17 years respectively when the CO2price increases at rates of $2/ton and $3/ton respectively. Investment returns go negative when the CO2 price increase exceeds $1.7/ton per year.
It is unlikely that VRE expansion or CO2 price increase happens in complete isolation. When these two effects happen at the same time, they tend to cancel each other out almost exactly for the natural gas power plant (as can be seen on the yellow bars above). This is an important element that reduces the risk involved in load-following fossil fuel power plant investments.
Finally, the large impact of natural gas pricing is shown by the green bars. When natural gas prices fall to the level facilitated by the US shale revolution, excellent annualized returns in excess of 10% can be expected. On the flip-side, returns become negative when the natural gas price exceeds $8.2/GJ.
Conclusions
This article has quantified the impact of natural gas power plant risks on expected investment returns. Increasing CO2 prices present a very important risk for any new fossil fuel power plant. Gradually increasing CO2 prices eventually render the plant unprofitable, requiring it to shut down early (or be retrofitted with CO2 capture technology).
Wind and solar expansion presents a major benefit to a load-following gas power plant. These plants perform well in an electricity market with wide price swings because most output can be concentrated during the times with the highest prices. Since wind and solar expansion is highly likely in an environment with increasing CO2 prices, this dynamic substantially reduces the CO2 taxation risk.
Natural gas pricing was shown to have a very large effect on power plant profitability. This is a risk that investors and power plant operators have decades of experience with.
Given that the two new effects of CO2 prices and VRE expansion tend to cancel each other out, the business case for natural gas power plant investment is not expected to change much. Given that wind and solar technology-forcing has seen significantly more practical deployment than technology-neutral CO2 pricing, the business case for natural gas power plants may well improve even further over coming decades.


